Goal: After simulating an actual oil spill event, you will understand how oceanographers help to protect marine resources from pollution such as oil spills. You will use an actual modeling program, GNOME, to observe and predict oil spill trajectories. You will understand how weather and ocean conditions affect the fate of oil transport, and how modeling these conditions can help remediation efforts.
Materials: GNOME (General NOAA Operational Modeling Environment) installed with a location file. In this case, we use the Santa Barbara location file. Also required are a pencil, lab sheet and the "GNOME manual."
Materials: GNOME (General NOAA Operational Modeling Environment) installed with a location file. In this case, we use the Santa Barbara location file. Also required are a pencil, lab sheet and the "GNOME manual."
Part 1: Warm up- Recreate the Santa Barbara Oil Spill of January 28, 1969
The goal in part 1 is to test the model. Does it work? Can we actually use it? Scientists call this "hindcasting" (rather than forecasting). Hindsight is 20-20!
Procedure: 1. Set up the spill in the model using the "GNOME manual" and the details of the spill and local weather conditions provided below.
- Model Run Duration: 3 days
- Weather Conditions:
a. Current: Davidson current ("Relaxation state")
b. Wind: Variable
Day 1: NNW, 10 Knots (Auto-incremented by 24 hours)
Day 2: WNW, 10 Knots
Day 3: WSW, 15 Knots
- Spill Location: 34* 19' 54" N and 119* 36' 47" W
- Spill Amount: 100,000 barrels (non-weathering)
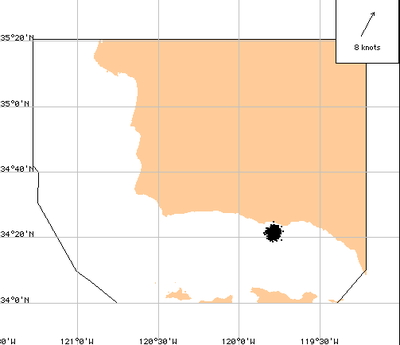
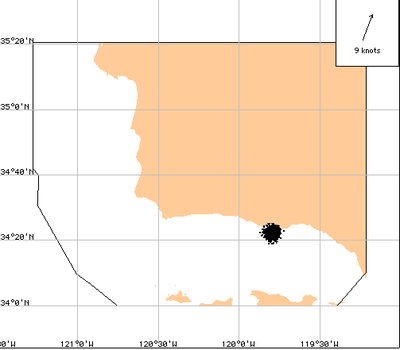
2. Simulate the oil spill (push "play"). Pay attention to the wind, time and location where oil comes onshore (you can pause the simulation if you want).
Part 1 Question: Does the spill you modeled agree with the local account of the actual Santa Barbara oil spill (below)? List some similarities and differences between the model and the observations of the actual spill.
Yes it agrees with it. Some similarities are the coordinates we put in are the same and it's at the Santa Barbara Harbor. Some differences are there are other coordinates in it as well and it affected them on February 4.
Part 2: What if the spill happened today? Disaster! There has been an oil spill off the coast of Santa Barbara.
It is your job as an NOAA Oceanographer to do everything possible to reduce the impact of the oil spill on the coastal environment. There are 10 miles of booms available at the NOAA response station in Santa Barbara, but more booms and other coastal cleanup materials need to be loaded and driven from the Los Angeles- this will take 24 hours. You must decide where to deploy the 10 miles of booms in Santa Barbara and what to do with the remaining resources available a day later.
- Today's Weather Conditions:
Current: Winter (Sep-Feb) choose "Relaxation"
Spring (Feb-May) choose "Upwelling"
Summer (June-Aug) choose "Convergent"
Wind: 10 Knots, ESE (all three days) or consult the local forecast.
- Spill Location: 34* 19' 54" N and 119* 36' 47" W
- Spill Amount: 100,000 barrels (non-weathering)
Part 2 Questions:
1. Describe some of the difference between the 1969 Santa Barbara oil spill and this hypothetical spill.
It was a little over to the left of the coast from the original spill.
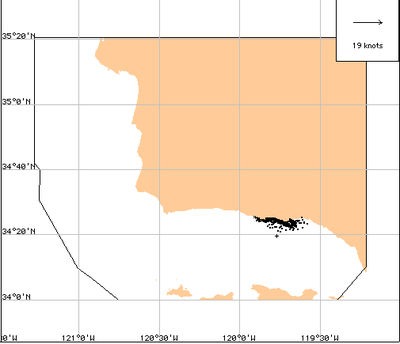
2. Where did the oil make landfall after the next day? How about the second and third days? You can indicate on the map on the next page:
The oil made landfall around the coordinates (34* 23' 33" N and 119* 42' 64" W). On the second and third day, all the oil was on the coast.
3. As an NOAA Oceanographer, where would you recommend the 10 miles of booms stored at Santa Barbara be deployed? Where would you send the extra resources from LA; a day's drive away?
I recommend to put it around the coastal area near the mountains of Santa Barbara and send the resources to the coastal mountain range of Santa Barbara.
Part 3: What are the most important things to know about the model?
Experiment with wind speed, direction and current. See what happens!
Lab Questions:
1. What are some important variables in the model? Why are they important? Which do you think are the most important variables that determine where the oil will end up?
Some important variables are the wind speed, direction, and the current state. They are important because one small thing can change what happens drastically.
2. What kinds of things changed when you made changes to the wind speed and direction? What happened when you changed the current?
Sometimes the oil traveled slowly or quickly. It would travel in the direction of the wind. The current also determined where the oil traveled as well.
3. The Channel Islands contain a delicate marine ecosystem. What kinds of conditions would threaten the Channel Islands if there were an oil spill in Santa Barbara channel.
The marine ecosystem could be destroyed.
4. Although this model was actually used by NOAA, it is several years old. Newer versions take several other factors into account. Can you think about other things that may affect how oil moves around that aren't modeled in this simulation and would improve the accuracy of the model?
The goal in part 1 is to test the model. Does it work? Can we actually use it? Scientists call this "hindcasting" (rather than forecasting). Hindsight is 20-20!
Procedure: 1. Set up the spill in the model using the "GNOME manual" and the details of the spill and local weather conditions provided below.
- Model Run Duration: 3 days
- Weather Conditions:
a. Current: Davidson current ("Relaxation state")
b. Wind: Variable
Day 1: NNW, 10 Knots (Auto-incremented by 24 hours)
Day 2: WNW, 10 Knots
Day 3: WSW, 15 Knots
- Spill Location: 34* 19' 54" N and 119* 36' 47" W
- Spill Amount: 100,000 barrels (non-weathering)
2. Simulate the oil spill (push "play"). Pay attention to the wind, time and location where oil comes onshore (you can pause the simulation if you want).
Part 1 Question: Does the spill you modeled agree with the local account of the actual Santa Barbara oil spill (below)? List some similarities and differences between the model and the observations of the actual spill.
Yes it agrees with it. Some similarities are the coordinates we put in are the same and it's at the Santa Barbara Harbor. Some differences are there are other coordinates in it as well and it affected them on February 4.
Part 2: What if the spill happened today? Disaster! There has been an oil spill off the coast of Santa Barbara.
It is your job as an NOAA Oceanographer to do everything possible to reduce the impact of the oil spill on the coastal environment. There are 10 miles of booms available at the NOAA response station in Santa Barbara, but more booms and other coastal cleanup materials need to be loaded and driven from the Los Angeles- this will take 24 hours. You must decide where to deploy the 10 miles of booms in Santa Barbara and what to do with the remaining resources available a day later.
- Today's Weather Conditions:
Current: Winter (Sep-Feb) choose "Relaxation"
Spring (Feb-May) choose "Upwelling"
Summer (June-Aug) choose "Convergent"
Wind: 10 Knots, ESE (all three days) or consult the local forecast.
- Spill Location: 34* 19' 54" N and 119* 36' 47" W
- Spill Amount: 100,000 barrels (non-weathering)
Part 2 Questions:
1. Describe some of the difference between the 1969 Santa Barbara oil spill and this hypothetical spill.
It was a little over to the left of the coast from the original spill.
2. Where did the oil make landfall after the next day? How about the second and third days? You can indicate on the map on the next page:
The oil made landfall around the coordinates (34* 23' 33" N and 119* 42' 64" W). On the second and third day, all the oil was on the coast.
3. As an NOAA Oceanographer, where would you recommend the 10 miles of booms stored at Santa Barbara be deployed? Where would you send the extra resources from LA; a day's drive away?
I recommend to put it around the coastal area near the mountains of Santa Barbara and send the resources to the coastal mountain range of Santa Barbara.
Part 3: What are the most important things to know about the model?
Experiment with wind speed, direction and current. See what happens!
Lab Questions:
1. What are some important variables in the model? Why are they important? Which do you think are the most important variables that determine where the oil will end up?
Some important variables are the wind speed, direction, and the current state. They are important because one small thing can change what happens drastically.
2. What kinds of things changed when you made changes to the wind speed and direction? What happened when you changed the current?
Sometimes the oil traveled slowly or quickly. It would travel in the direction of the wind. The current also determined where the oil traveled as well.
3. The Channel Islands contain a delicate marine ecosystem. What kinds of conditions would threaten the Channel Islands if there were an oil spill in Santa Barbara channel.
The marine ecosystem could be destroyed.
4. Although this model was actually used by NOAA, it is several years old. Newer versions take several other factors into account. Can you think about other things that may affect how oil moves around that aren't modeled in this simulation and would improve the accuracy of the model?

|

|
|
|
|
